


In this research study, we analyzed data from the National Center for Audit of Oesophago-gastric Cancer. Machine and deep learning algorithms have brought a breakthrough in the medical domain [54]. We conducted an in-depth statistical analysis and comparative study using machine learning algorithms to determine which methods practitioners can use to manage large datasets and identify optimal strategies. Gastric cancer originates in the stomach lining and has the potential to spread to other regions of the body [11]. Though tissue regeneration is possible [55], it is still a fatal disease. the detailed investigation in this study will help practitioners predict OGC at an early stage. The investigation workflow is presented in Fig. 3. The methodology of the research paper is elaborated stepwise.
-
Download the NOGCA dataset from the authentic data repository.
-
Select the data from the years 2017 to 2021.
-
Analyze the data statistically to gain data insights.
-
Discovering patterns and deriving insights
-
Comparative Analysis using ML models. The following models are used for the comparative analysis.
-
Linear Regression
-
Random Forest
-
Lasso
-
Decision Tree
-
Ridge
-
Gradient Boosting
-

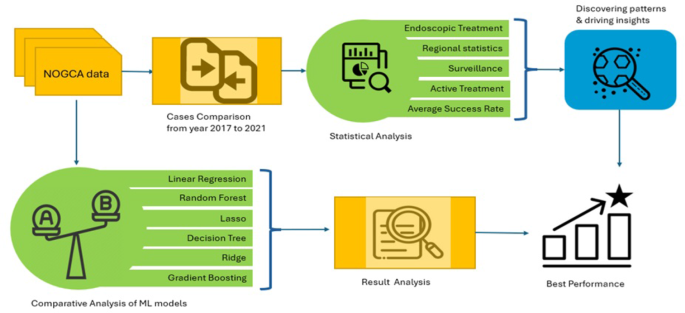
Statistical analysis and machine learning algorithms reveal that one approach outperforms the others for this dataset.
Data collection
The National Oesophago-Gastric Cancer Audit (NOGCA) dataset [56] contains all clinical and statistical data on oesophageal-gastric cancer patients. This nationwide UK database collects data from healthcare organizations and medical institutes. This dataset contains many patient cases from 2017 to 2021, making it a useful EGC/HGD research and analysis data source. NOGCA provides important patient and therapy history factors such as age, gender, race, and location. Cancer pathological data includes tumor stage, histological subtype (adenocarcinoma and squamous cell carcinoma), grade, and anatomical location (oesophagus and stomach). Treatment information includes surgical type, chemotherapy, radiation therapy, targeted therapy, etc. The NOGCA dataset features various characteristics relating to each case, such as:
-
Statistical Data: This covers patient-specific details like their age, sex, and other relevant statistical information.
-
Pathological Stage Data: Knowing the stage at diagnosis makes a difference in understanding its progression further.
-
Treatment Details: Details about the type of curative surgery treatments patients receive are also provided here.
-
Death and Survival Rates: Provided here is data pertaining to 30-day adjusted mortality and 1-year survival rates respectively.
-
Length of Patient Stay: The median of the length patient stays in the hospital while receiving cancer treatment.
-
Tumor Records Submitted: Records submitted for tumor diagnosis and staging respectively.
-
Patient Health Results: Information regarding patients’ status at discharge, pathological reports, and staging statuses like tumor, node, and metastasis (TNM).
-
Case Ascertainment Rate (CARP): This measure indicates how often cases were properly ascertained during an audit.
The NOGCA dataset is known for its large test measure and longitudinal nature. A detailed investigation of esophageal gastric cancer and HGD wordly patterns is possible. The extensive and shifting information allows analysts to study the disease’s risk factors, treatment effectiveness, access to healthcare, and regional variance in occurrence. Security and privacy are crucial for any large health dataset. NOGCA data is anonymized, subject to strict privacy regulations to protect patient anonymity, and researchers must meet NOGA ethical requirements for the study. Researchers utilizing it for other research must get permission. Finally, the NOGCA dataset provides healthcare researchers and professionals with vital insights about oesophageal-gastric cancer and HGD that might enhance patient treatment and outcomes. NOGCA collects data from UK hospitals and clinics that diagnose and treat esophageal and gastric cancer. NOGCAs National Oesophago-Gastric Cancer Audit program tracks OGC patient treatment. “Data.gov.uk” is an open data site where the UK government distributes datasets across many places to make them available to the public, academics, and enterprises. The NOGCA dataset on “data.gov.uk” enables openness, enhances data-driven research and analysis of English E. and English G. cancer care, and aids data-driven decision-making. This information may help researchers, policymakers, and healthcare specialists identify cancer care quality patterns and make educated healthcare choices to enhance patient outcomes and services. The UK government fosters open data, researcher-policymaker cooperation, and evidence-based policymaking by uploading datasets like NOGCA on “data.gov.uk”. Through “data.gov.uk” stakeholders like NOGCA users may get information and enhance cancer care plans and treatment options.
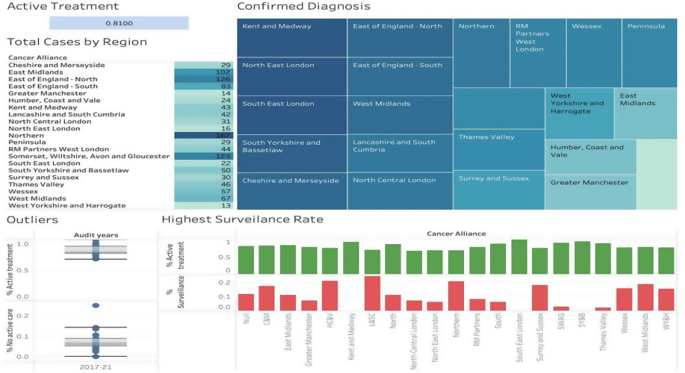
Figure 4 provides an extensive snapshot of HGD cases across locations, covering key aspects like treatment, diagnosis and case numbers across each. Card, one depicts an average active treatment rate which stands at 0.8170 per case on an annualized basis, this represents the percentage or rate at which patients engage in active care over no active treatment for each dataset. A box plot highlights any outliers related to active vs no active care as outlier columns; North Central London and Northeast London show outlier values within “No Active Care”, suggesting unexpected data points within these regions that require further examination. A tree map displays confirmed diagnoses by second pathologists across various regions. This allows practitioners to see how often second pathologists confirm initial diagnoses as well as regional variance in this process of confirmation. This table shows the total number of High-Grade Dysplasia (HGD) cases by locations. Data visualization and analysis demonstrate that Northern has the highest case count at 167 while “West Yorkshire” had 13; these figures provide valuable insight into HGD prevalence across different locations. To deal with the missing values and data anomalies, those values were removed.

Statistical analysis
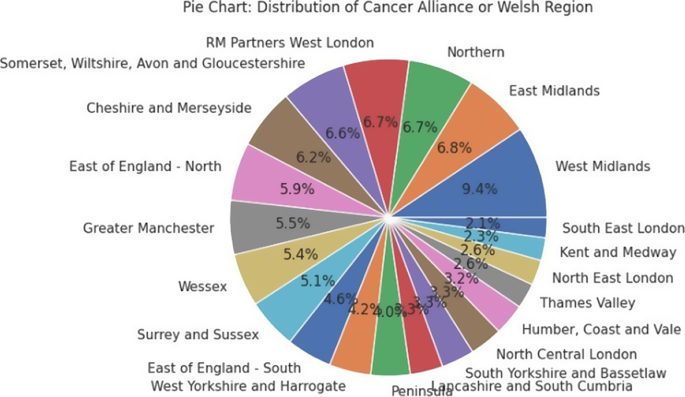
In order to perform the statistical analysis, we used Tableau software [57]. Fig. 5 shows a visual presentation of how high-grade dysplasia (HGD) cases were distributed among cancer alliances during two different years, 2017 and 2021, and by measure of cut in the pie chart representing rate contributions by each cancer alliance to overall HGD cases. In 2017, the “Northern” Cancer Alliance saw the highest percentage of HGD cases at 12.8% of total cases; this indicates a greater concentration in this area during that year. Meanwhile, “West Yorkshire and Harrogate” cancer alliance saw only 8 cases total and thus comprised the smallest portion in its pie chart, showing this region had relatively fewer HGD patients overall in 2017. A notable shift occurred in 2021: When Northern Cancer Alliance became responsible for most HGD cases, increasing from 15% in 2020 to 17% by that year, only reported 6 cases – perhaps suggesting that over time this distribution will shift across different locations.

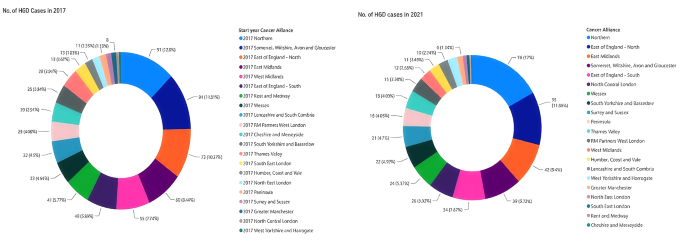
Shows the comparison of HGD cases from 2017 to 2021
Regional statistics
As seen in Fig. 6, regional statistics provide a thorough breakdown of 3 treatment approaches—active treatment, endoscopic treatment, and surveillance treatment—over different districts. As shown in Table 1, around 79% of cases receive active therapy on average, representing its prominence within our approach portfolio. The median is slightly below 80%, indicating there are moderate levels of variance around the mean. Even at 39.28%, its minimum percentage indicates relatively high variability levels. Maximum values of 100% indicate regions that exclusively choose active treatment; 0.12 standard deviation indicates relatively few points being scattered around the mean, suggesting consistency within active treatment percentage levels.

Regional statistics of HGD
Endoscopic Treatment Moving onto Endoscopic Treatment, Table 1 displays that on average approximately 71.80% of cases were managed endoscopically; its median value being close to 73.61% indicates this was relatively balanced across regions, though minimum levels at 21.10 were found in some regions to represent smaller proportions being treated endoscopically whereas 95.24% indicated it as being predominant approach in certain locations and its standard deviation value indicated more spread-out distribution reflecting greater variations among its use than with Active treatment approaches.
Surveillance It stands at 12.01%, demonstrating that around 12% of cases are treated through observation. The median value is 11.1%, indicating slightly right-skewed dissemination, while 0% as the least value means few regions do not depend on observation as a treatment approach, as in Table 1. Furthermore, 39.28% as a maximum value shows how surveillance plays a more significant part; its standard deviation esteem of 0.09 shows generally direct variations.
Active treatment and surveillance by the Cancer Alliance This study tracks the Cancer Alliance’s Total Active Treatment and Total Surveillance statistics. Normal monitoring decreases by 1.22 units per unit of Active Treatment across all entities (Fig. 7). However, Lancashire and South Cumbria have a higher surveillance involvement rate than active treatment at 24% vs 7%. Active treatment values in Southeast London are unusual; examining Active treatment and Surveillance might reveal regional concentration and dispersion. The largest proportion of active treatment patients is in Southeast London (100%), South Yorkshire and Bassetlaw (94%), and Kent and Medway (93%). They live in London (100), Yorkshire (94%) Medway (93%), and Kent (93%). North Central London had an Active Treatment rate of 68% to 100% in Southeast London, a 32% difference with an average of 81%. Five substances accounted for 29% of Active treatments.

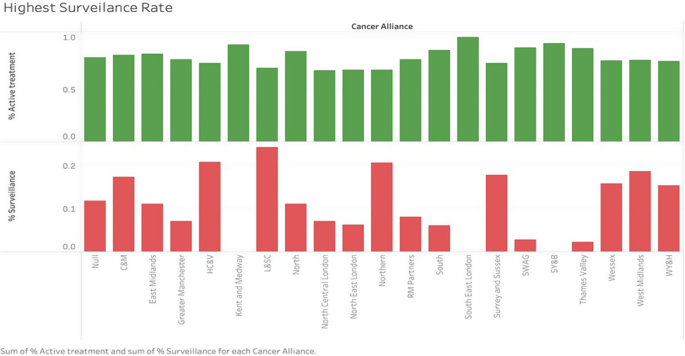
Active treatment and surveillance by region
The total proportion of patients under surveillance across all entities is 2.13%, with Lancashire and South Cumbria contributing 24%, Humber Coast Vale 21%, and Northern 21%. Surveillance values are absent for 15% of entities, whereas 50% of entities account for 81% of surveillance utilization. Lancashire and South Cumbria provide 24%, more than double the total of 20 entities. In Fig. 7, groupings with comparable Surveillance values exhibit a clear pattern: 8 entities decline between 15 and 24%, while 5 others slide between 0 and 3%. These findings show changing approaches to active treatment and surveillance across regions, and the concentration of metrics within certain entities and significant variance in percentages show how important regional considerations are when analyzing healthcare patterns for health evaluation.
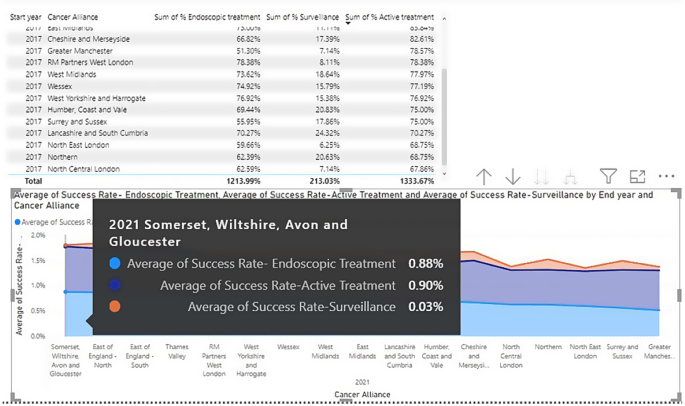
Average success rate by 2021 Figure 7 shows an area map of Active, Endoscopic, and Surveillance Treatment techniques by region for 2017 and their prevalence and effectiveness rates. Figure 8 reveals that Somerset and Wiltshire had the most active treatment cases at 89.62%, indicating a focus on vigorous care. North Central London had the fewest active treatment instances (67.86%), suggesting this technique should be minimized. Comparisons of 2021 success rates show this development. Somerset and Wiltshire had the greatest active treatment percentage in 2017 but now has a 0.90% success rate, suggesting its treatment efforts were effective. North Central London had the lowest active treatment percentage but a 0.68% success rate, indicating therapeutic progress. Somerset and Wiltshire had 0.88% endoscopic success rates, suggesting future growth. Endoscopic therapy seems to have worked in this location.
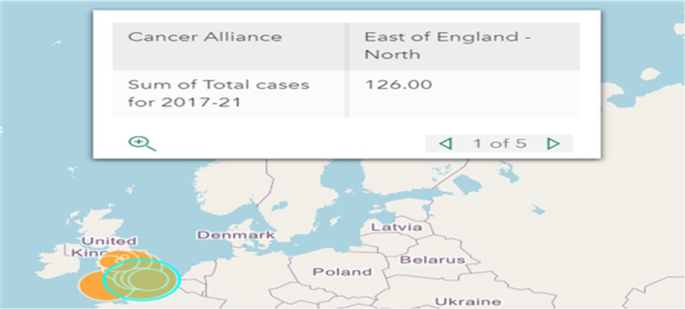
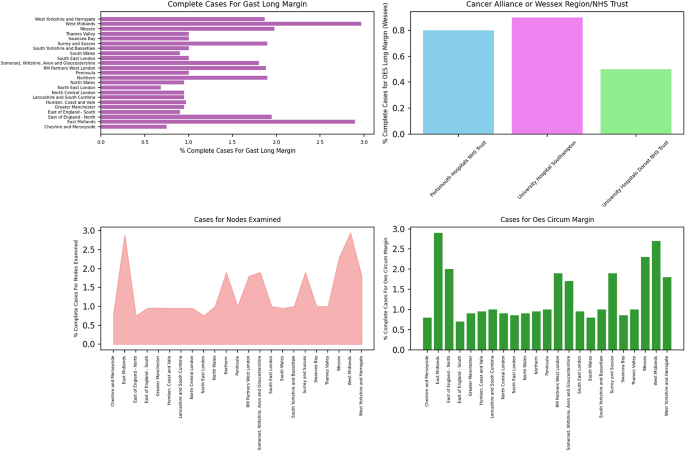
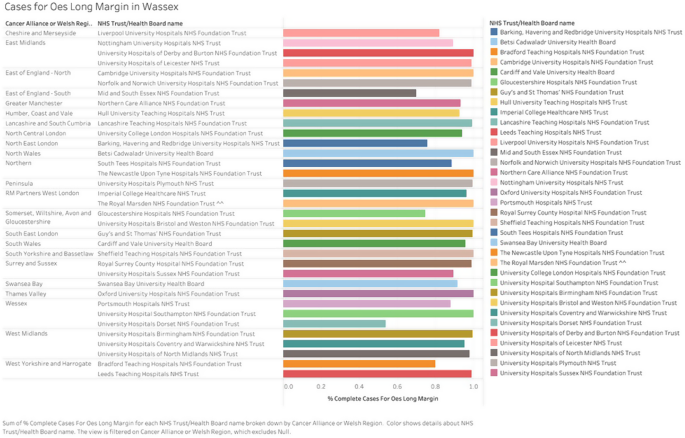
Endoscopic therapy had the lowest success rate in Great Manchester at 0.51%, suggesting obstacles or geographical differences. With a 0.24% surveillance treatment success rate, Lancashire seems to be successful in identifying and controlling cases. Somerset and Wiltshire had the lowest surveillance success rates at 0.3%, indicating room for improvement. It shows how objectives and results vary and how healthcare methods affect patient health. At this depth of examination, we undertake an in-depth data-driven journey, digging profound into critical metrics that provide invaluable information in the healthcare domain. Through rigorous examination, our aim is to understand the relationships and patterns these metrics hold which may provide new insight into aspects such as patient care strategies and results (Fig. 8 shows the Walle’s Distribution of Cancer Alliance Regions and Fig. 9 shows, the distribution of OGC cases by region). Figure 10 depicts our analysis of Total Cases with OES long margin across various periods and NHS Trusts, highlighting the significant disparity in performance between University Hospital Southampton and Portsmouth Hospitals, with University Hospital Southampton averaging 0.12 higher than Portsmouth Hospitals NHS Trust. Regional trends were apparent as Cancer Alliances and Welsh Regions focused on metrics, while the OES circum margin exhibited similar patterns to previous metrics. However, total cases for GAST Long Margin revealed significant discrepancies, particularly in the West Midlands, which displayed markedly divergent scores across entities, highlighting its considerable impact.
Insights from total cases for OES long margin, in this comprehensive investigation, we explore the whole of total cases for OES long margin across different time periods and categorize it by NHS Trust & Health Board name as illustrated in Fig. 11. University Hospital Southampton NHS Foundation Trust often showed higher values compared to Portsmouth Hospitals NHS Trust, showing an average difference of 0.12. Wessex stood out as particularly impressive. One data point there stood out among others. On the other hand, Portsmouth Hospitals NHS Trust displayed lower values when compared with University Hospital Southampton NHS Foundation Trust with an average difference of 0.12; Wessex registered 0.88 in that instance. University Hospitals Dorset NHS Foundation Trust also posted lower figures than Portsmouth Hospitals NHS Trust with an average difference of 0.34; Wessex registered at 0.54 as evidence in this instance.


Distribution of OGC cases by region

Completion in OGC, Margins and nodes examination

Completion in OGC, compete cases for OES and long margin
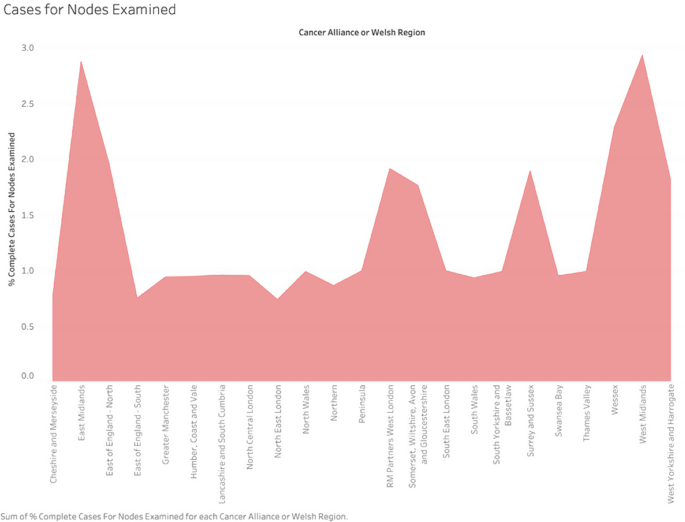
Discovering patterns in complete cases for nodes examined, moving our focus, we discover complete cases for nodes Examined by Cancer Alliance or Welsh Region and focus on their concentration among certain entities. As shown in Fig. 2, this number ranges between 2.36% to 9.39% across regions – West Midlands being notable at having achieved 9.39% surpassing even average; further demonstrating their role in shaping overall metrics landscape. This analysis underlines their significance and underscores key entities’ contribution.

Shows the complete cases for node examined
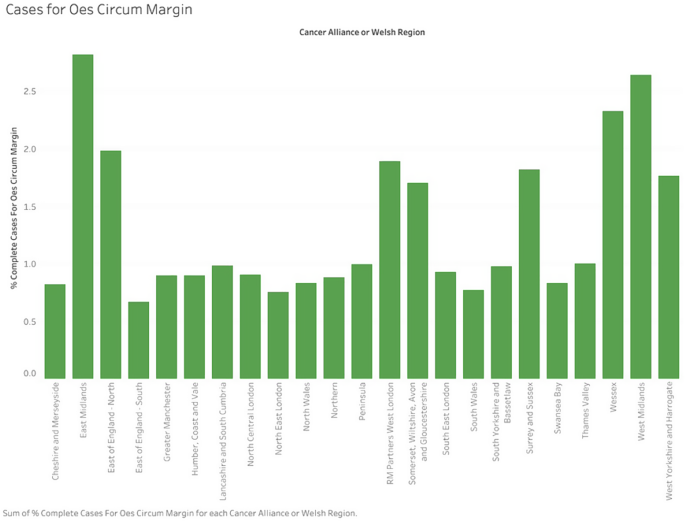
Cancer Alliance or Welsh Region, as a percentage of total cases examined, was further considered during the analysis, along with their Complete Cases Examined Rate expressed as a percentage. A total of 31.19 nodes examined across 23 entities was observed with North East London having 2.36% and West Midlands reaching 9.39% with North East. London falling between 2.36 and 9.39 respectively and being responsible for 7.04 of that difference; 35 entities contributed 56% each to total Nodes Examined with West Midlands surpassing it by one entity at 9.39; Additionally, the top three entities collectively comprised 26% overall nodes examined figures. Insights from complete cases for OES circum margin: Our analysis extends to Complete OES Circum Margin Cases categorized by Cancer Alliance or Welsh Region, reflecting trends seen in previous measurements. Figure 13 illustrates the significant role of major organizations, with East Midlands contributing 9.34%, in influencing this metrics environment. Similarly, our analysis included the assessment of the number of OES Circum Margin Complete Cases by Cancer Alliance or Welsh Region, culminating in a total of 30.09. This statistic exhibited cumulative values across 23 entities, amounting to 30.09. This distribution exhibited a notable range, from 2.24% (East of England – South) to 9.34% (East Midlands), indicating a total variance of 7.11%. Eight organizations, representing 35%, accounted for 56% of the total amount in this instance. The East Midlands, at 9.34%, surpassed all other entities by surpassing the norm by 7.96% points, as seen by prior measurements. Additionally, as previously noted, three entities together constituted 26% of the total Complete Cases for OES Circum Margin cases.

Complete cases for OES circum margin
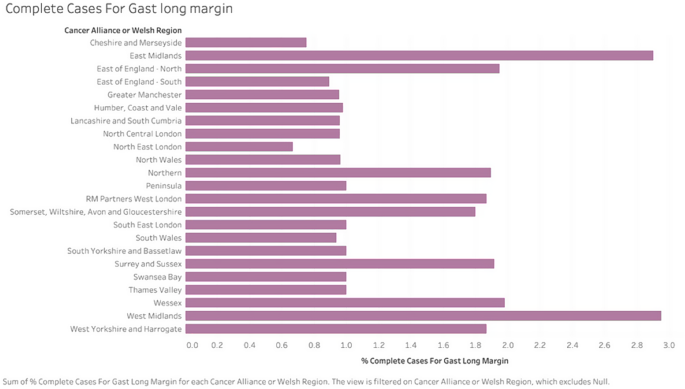
Underneath patterns in complete cases for GAST long margin: Analysis focuses more closely on Complete Cases for Gast Long Margin (Fig. 14), showing a wide variety of results between 18% to 82% across entities, with West Midlands dominating with an enormous 63% difference; this highlights their influence in shaping the overall landscape. Last, this analysis examined Complete Cases of Gast Long Margin across Cancer Alliance or Welsh Region entities. Here, the cumulative total reached 3.61 for both entities with distribution patterns that ranged from 18% (Northeast London) to an impressive 82% (West Midlands), an approximate 63% difference. Furthermore, an impressive average sum of Complete Cases per entity registered 1.81 for Gast Long Margin cases.

Show the complete cases for Gast Long Margin
Driving insights from the patients with pathological records As part of our research, we examined Patient Records with Pathological Records across Cancer Alliances/Welsh Regions/NHS Trusts/Health Boards. Of all 5,121 total Patients With Pathological Records across these entities, West Midlands stood out with its impressive contribution of 521 Patients; their distribution varied between 19 and 572 entities, showing clear patterns within Patient records from different entities.
Understanding trends of patients with pathological Our exploration continues with the Patients With Pathological TNM Stage, showing the differences in this metric between Cancer Alliances or Welsh Regions. Figure 15 displays contributions by certain entities, specifically amongst the top three entities, which help shape this overall metric landscape.

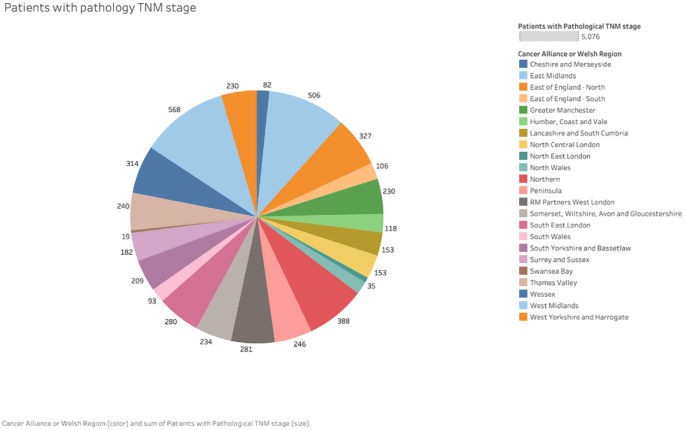
Patients with pathology TNM stage
Discovering insights from the patients with nodal dissection As this study progresses, we explore Nodal Dissection over various entities. Nottingham University. Hospitals NHS Trust, Guy’s and St Thomas’ NHS Foundation Trust and Newcastle Upon Tyne Hospitals NHS Foundation Trust all make significant contributions that demonstrate healthcare provider impactful results. By further investigating, we discover the Northern region contributed 400 records across two subcategories for 7.81% of the overall dataset as seen in Fig. 16. Contributors mainly included Newcastle Upon Tyne Hospitals NHS Foundation Trust with 265 records, followed by South Tees Hospitals NHS Foundation Trust with 135. Subcategories ranged in number between 135 (South Tees Hospitals NHS Foundation Trust) and 265 (The Newcastle Upon Tyne Hospitals NHS Foundation Trust), yielding an average contribution to this region from this category (based on South Tees Hospitals’ share) of 200 contributions overall. Figure 17 depicts a KDE plot which shows the distribution of Nodal Dissection Metric, used for measuring medical-based nodal dissection severity. The graph depicts nodal dissection values within their range and their frequency across a dataset, while their shape displays how those node dissection values have been distributed throughout. The x-axis represents these ranges; its y-axis depicts their density. KDE plots show how nodal dissection values have been distributed throughout. KDEs often depict Somerset, Wiltshire, Avon and Gloucestershire where nodal dissection values most frequently occur with densities between 0.000 to 0.0016 on their y-axes reflecting likelihood levels.

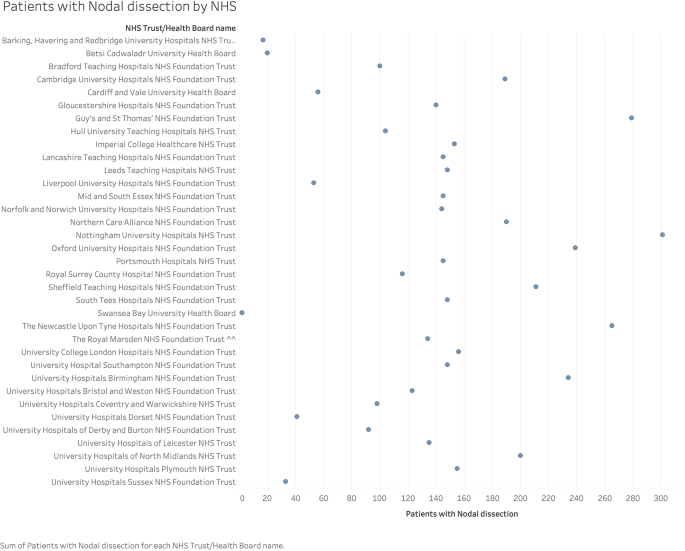
Patients with nodal dissection

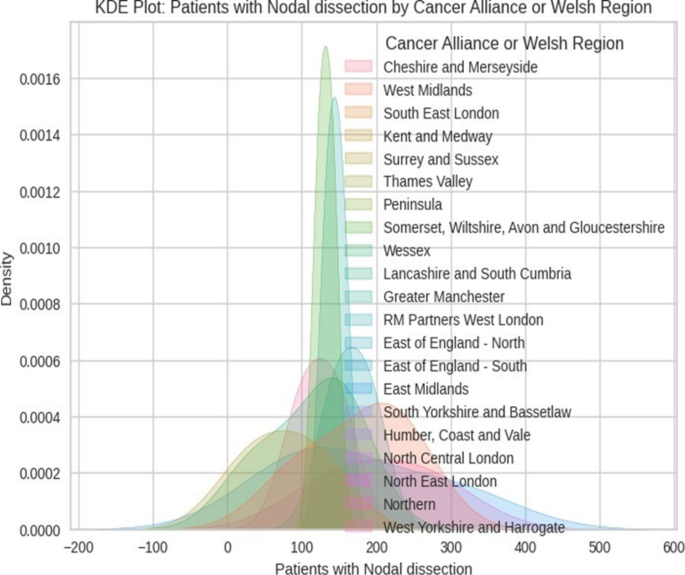
Distribution of patients with nodal dissection across different regions
Investigating trends in patients undergoing curative procedures Our analysis further explores patterns among Patients Undergoing Curative Procedures, providing insight into Cancer Alliances or Welsh Regions where Patients resided who had undergone curative procedures. West Midlands stands out with 11%, showing its notable influence; concentration among certain entities shows its critical position, as seen in Fig. 18.
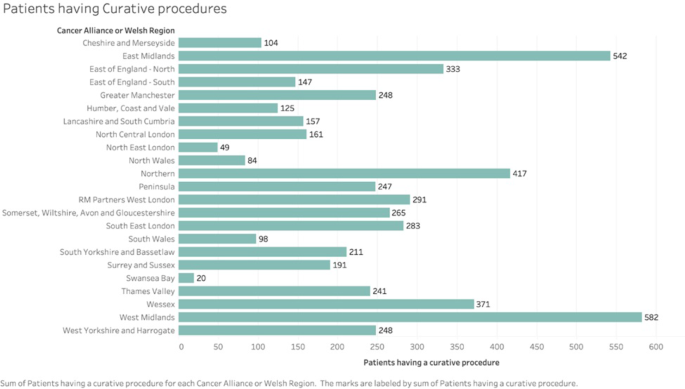
Patients having curative procedure
Discovering patterns in patients with discharge data status We also investigate the connections between patients with discharge date and discharging status, providing insight into their interrelations. Figure 19 highlights trends and patterns that shed light on their significance as healthcare outcomes metrics; on this path, we propose to prepare healthcare professionals with knowledge for informed decision-making with positive patient healthcare results.

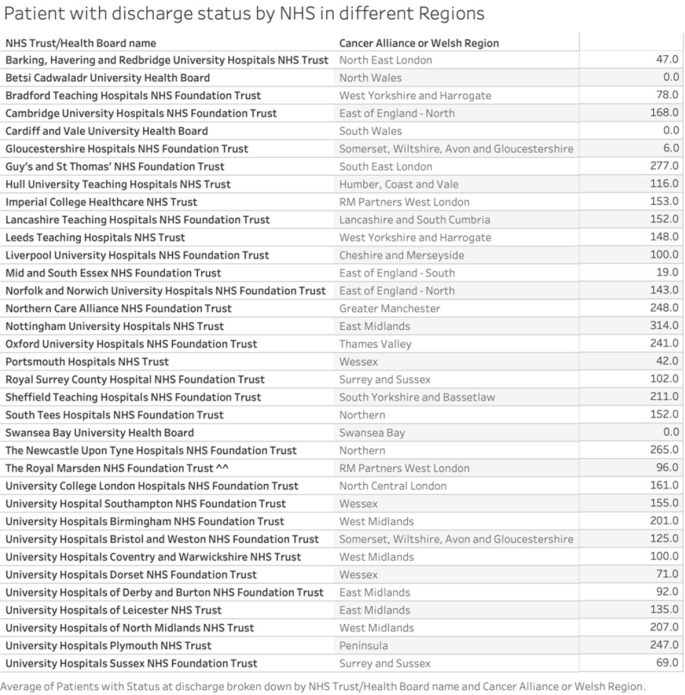
Shows patients with discharge status
Investigation of tumor record submission; Analysis variation by expected cases in different regions In this analysis, we study tumor records submitted within NCRAS/PEDW 2019–21 Expected Cases Analysis as part of Cancer Alliance or Welsh Region analyses and categorize them based on Cancer Alliance or Welsh Region designation. Analysis discovered that total tumor records submitted across nine entities amounted to 19,168. Notable contributions come from 150 to 199 tumor submissions with 4,964, 100–149 submissions totaling 4,137 submissions and 200–249 with 3,356. West Midlands led submissions in this range with 627, while Northern claimed 624 and North East London 351. Submissions varied between zero (0–49) submissions to 4,964 (150–199) for this time frame, making up an approximate variance of 4,868 with an average submission amount of 2,130. Tumor records submitted are concentrated, with three entities accounting for 65%. Meanwhile, those between 150 and 199 represent 26%. At 150–199, Tumor records submitted accounted for 4.964, representing 26% of total Tumor submissions across 20 subcategories across the nine entities. West Midlands is driven in submissions with 627 subcategory missions, followed by Northern with 624, and North East London with 351. There was an even distribution from Thames Valley (61 submissions) up to West Midlands (627), with an average submission count of 248.52. 8 subcategories made up 63% of cumulative submissions within this range; of those eight subcategories, two comprised percent. Analysis of tumor record submissions between 100 to 149 revealed 4,137 tumor records across 17 subcategories, representing 22% of overall submissions. Eminently, RM Partners West London driven with 541 submissions; followed by Somerset Wiltshire Avon Gloucestershire who contributed 446 and Greater Manchester with 430. Additionally there was an average distribution between North Central London 86 submissions to 541 (RM Partners West London), or approximately 243.45. Within this range, 7 subcategories accounted for 67% of submissions; 3 subcategories made up 34%. Last, our analysis explored submissions between 200 and 249; these submissions contained 3,356 Tumor records submitted across 12 subcategories for evaluation – making up 18% of submissions overall. Eminently, West Midlands led with 436 submissions; Northern had 428; Humber Coast & Vale had 409; Somerset Wiltshire Avon Gloucestershire had an average submission count of 279.67 within this range and five subcategories contributed 59% while two subcategories made up 26%, as seen in Fig. 20.

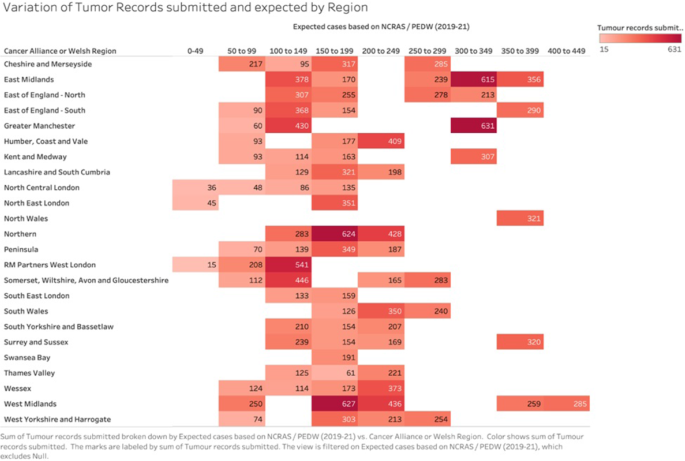
Variations among tumor records by region
Analysis key metrics across NHS trust/health records Figure 21 showcases 3 metrics, such as adjusted 30 days mortality rate, 90 days Mortality rate and Median Length of Stay (Days), across 35 NHS Trust/Health Board names. Studies of their relationships demonstrate that Adjusted 30 Days Mortality Rate does not have an evident relationship to the Median Length of Stay (Days). Although among NHS Trusts/Health Boards there may be certain entities which exhibit notable metric values as evidenced in Fig. 21, some entities do have noteworthy ratios. Gloucestershire Hospitals NHS Foundation Trust exhibits impressive values for both its 30-days mortality rate and 90-days mortality rate, both showing increased levels of death over time. Conversely, Royal Marsden NHS Foundation Trust and Swansea Bay University Health Board record lower values for Adjusted 90-Day Mortality Rate; with University Hospitals Coventry and Warwickshire NHS Trust reporting an elevated mortality rate. Norfolk and Norwich University Hospitals NHS Foundation Trust stands out with an average Adjusted 30-days Mortality Rate per Entity value of 0.01 while also boasting a lower Median Length of Stay (Days). Where the adjusted 90-days mortality rate per entity and median is 0.03 however the median length of stay per entity per entity was calculated at 10.51 days; hence this time-period had 10 deaths overall! As shown in Fig. 21, we examined three essential healthcare metrics – Adjusted 30-days Mortality Rate, 90-days Mortality Rate and Median Length of Stay (days). Our goal was to uncover any associations or patterns which might provide more insight into healthcare results.

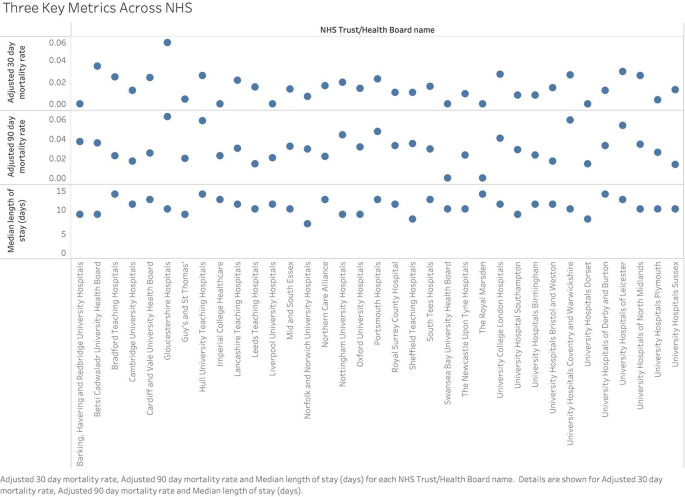
Key metrics across NHS Trusts/Health boards
As we evaluate the relationship between Adjusted 30 day Mortality Rate, 90 Day Mortality Rate and Median Length of Stay (days), and Median Length of Stay (days), there was no strong and stable correlation. This indicates that changes to mortality rates over a certain timeframe might not directly influence hospital stays directly; while individual entities may exhibit higher values for certain metrics than others; our analysis seeks to uncover broad trends within our dataset by visual depicting its distribution – Adjusted 30 Day Mortality Rate ranges between 0.06 to 0.06 while Median Length of Stay (days), which ranges between 7 and 13.
link