


This research was approved by the Ethical Review Board of the University of Amsterdam (022-SP-14541). All research was performed in accordance with relevant guidelines and regulations. Informed consent was obtained from all participants. In total, two studies were conducted. It applies to both studies that participants were recruited via a research panel (Ipsos), the original survey was presented in Dutch, and the survey was programmed in Qualtrics.
Study 1
The first study aimed to identify relevant attitude elements that served as input for the items tapping into attitudes in the survey administered in Study 2. To do so, health-care users that were exposed to PMD in the last two years (NStudy 1 = 66) were asked to list their beliefs (i.e., advantages and disadvantages) and emotions regarding the use of PMD. The first section provided only general instructions; the second section repeated the questions with the instruction to keep in mind the effects of the use of PMD for health, safety, and the environment. More information on the method and results of Study 1 can be found in Appendix 1.1. In summary, the following themes were identified in the open-text responses and used as input for the survey. Respondents reported beliefs about the use of PMD related to hygiene, ease of use and availability for health-care professionals, their necessity, durability, quality, material properties, costs and their necessity of use, but also their environmental pollution, waste volume and management, recyclability, long- and short-term health consequences, unnecessarily usage and raw materials for production. Regarding emotions, respondents reported both positive and negative feelings, and mentioned safety, guilt, and concerns about both safety and environmental consequences. Finally, their answers referred to the presence or absence of awareness about the use of PMD. Participants’ terminology also served as input for formulating the corresponding survey items in Study 2.
Study 2
Participants
In total, 1001 participants completed the survey (NStudy 2 = 1001). This total sample contained both people who reported that, in the last two years, they received health care in which PMD were used (n = 501; from here on called the high relevance subsample) and people who reported that, in the last two years, they received either no health care or health care in which no PMD were used (n = 500; from here on called the low relevance subsample; see Appendix 1.2 for the items for subsample allocation). Around 500 respondents per subsample was expected to provide sufficient power to accurately estimate networks: a moderately sized network (maximum of 30 variables) calculated with continuous data from a sample of 250 respondents is likely to result in accurate network estimation21. Additionally, network stability checks were conducted after data collection. Only participants who passed at least one of two attention checks were allowed to complete the survey.
Table 1 provides the sample’s demographic information. The total sample was broadly comparable to the Dutch adult population in terms of age and gender (slightly more females). This cannot be specified for the relevance subsamples, since it is unknown how the population is distributed over these subsamples.
Measures and procedure
All survey items are provided in Appendix 1.2 and Fig. 1 presents the survey’s flow and its elements. After a short introduction and obtaining written consent, the survey started with questions about demographics and relevance. After presenting a definition of PMD, the items on conventional PMD were administered. Subsequently, a definition of bio-based plastic was provided (i.e., made from biomass), followed by the statement that the difference between bio-based and regular PMD lies in its materials, after which the items on bio-based PMD were administered. Note that no statements on environmental impact or sustainability were included. Such a brief introduction is expected to approach a rather realistic setting, assuming that the implementation of PMD from alternative materials is accompanied by little or no information toward patients. Participants were instructed to answer questions about bio-based PMD as if they were already being used in healthcare. The items in the bio-based section were phrased like the items on conventional PMD but with the word ‘bio-based’ inserted before PMD. Also, the bio-based items included the phrasing ‘…, compared to current plastic medical devices, …’. Items from the section on conventional PMD that could not be answered from a hypothetical situation were not included in bio-based items (e.g., ‘Plastic medical devices are cheap’). Within the sections on conventional and bio-based PMD, items were presented in clusters (i.e., general attitude, beliefs, emotions, control and social norms, trust), and within these clusters the order of items were randomized where possible. The last part of the survey contained items on material preference for PMD that a) do not come into contact with the body, b) come into contact with the outside of the body, and c) come into contact with the inside of the body. This distinction was inspired by European legislation on categories of medical devices and corresponding regulations based on their risk for patients. Participants indicated what material they would choose, ranging from 1 (definitely current plastic) to 7 (definitely bio-based plastic). Finally, participants answered a question about their understanding of bio-based plastic and then completed health-related items.

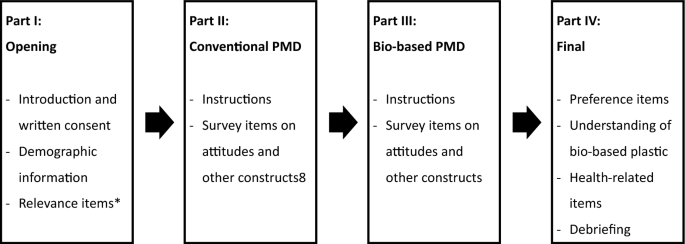
Survey flow and elements. *Answers determined allocation to relevance subsamples (or exclusion from survey; see appendix 1.2 for more information). The rest of the survey was identical for both subsamples.
After collecting the data, survey items were combined into variables to include in the network (see Appendix 1.3 for a detailed overview). Table 2 provides an overview of these variables, including their interpretation and example survey items. Variables can consist of either a single item or the mean score on multiple items (except for the ambivalence variable that was calculated with a formula; see Appendix 1.3). In case a variable was calculated with multiple items, the set of items was either predetermined based on theoretical constructs or based on results of a dimension reduction analysis. The latter was conducted for the items covering beliefs and emotions.
Analysis
Preliminary analyses
Dimension reduction analyses to combine items into variables were conducted with Principal Axis Factoring with oblimin rotation due to the expected intercorrelation between items. This was done with the dataset from the total sample. Independent sample t-tests were used to compare variable scores between the relevance subsamples.
Network analysis
Networks were estimated with the survey data by using the EBICglasso method for continuous and ordinal variables21. This method entails Gaussian Markov random field estimation using graphical LASSO and extended Bayesian information criterion for the selection of optimal regularization parameter22. Edges can be interpreted as partial correlations, thus associations between variables after controlling for the effects of the other variables in the network. Analyses were conducted in R23, for which we used the packages bootnet22 for network estimation, stability and accuracy measures, and difference tests; igraph24 for community detection; qgraph25 for the centrality plots; and the NetworkComparisonTest26 to compare the networks of the subsamples.
link