


Longitudinal mNGS testing
A total of 4,828 mNGS tests were performed from June 2016 to April 2023 (Table 1). The number of tests performed annually increased by nearly 10-fold from 116 in 2016 to 1,067 in 2022 (Fig. 1). Approximately 56% of patients were male; the mean age was 41.5 years, and children, defined as being younger than 18 years of age, comprised 24.2% of the cohort. Most mNGS tests (n = 4,075, 84.4%) were performed for US patients representing 46 different states, with 2,420 tests (50.1%) from California, 722 tests (15.0%) from regional or national reference laboratories in the United States and 31 tests (0.64%) from other countries (Fig. 1). The median turnaround times for UCSF and non-UCSF patients were 8.2 and 11.4 days, respectively, from sample collection to result (P < 0.0001), and 3.6 and 3.8 days, respectively, from start of sample processing in the laboratory to result (P < 0.0001). The longer turnaround times for non-UCSF patients are explained by delays resulting from the clinician decision to order mNGS testing, shipping of samples, and accessioning, aliquoting and batch testing of samples after receiving them in the laboratory.

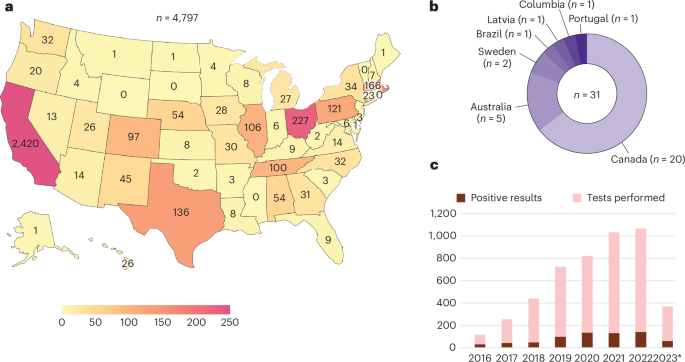
a,b, Distribution of tests ordered by state (a) and internationally (b). A total of 4,075 mNGS tests were performed from CSF samples collected from the United States, California being the most frequent state of origin (n = 2,420 samples). Reference laboratories such as Associated Regional and University Pathologists, Inc., Labcorp and Mayo Clinic (n = 722) receive tests from multiple states, so the location of individual samples cannot be tracked and thus are excluded from the figure. 14.8% (n = 715) of samples were sent from pediatric hospitals. c, Number of tests performed by year and number of positive results, excluding results that were reported possible or likely contaminants. *Data shown are samples analyzed up to April 2023.
Source data
We also evaluated quality control (QC) metrics associated with mNGS testing. High host background was more frequently observed in DNA (12.2%) than RNA (1.6%) libraries. This finding was attributed to higher efficiency of DNase treatment of RNA libraries in reducing background compared to antibody-based methylated DNA removal for DNA libraries14. RNA libraries were more difficult to amplify due to low amounts of input nucleic acid and/or degradation, resulting in low read counts of <5 million that were seen more frequently in RNA libraries (5.3%) than DNA libraries (2.6%). QC failure due to inadvertent errors in sample processing that required repeat testing was rarely observed (<1%).
One or more commensal and/or environmental organisms were detected in 512 (10.6%) of 4,828 samples. These results were all classified as negative after review by the laboratory director and were reported as possible (single taxon) or likely (multiple taxa) contaminants6. Contaminants were reported more often for non-UCSF compared to UCSF samples (7.8% versus 5.4%, P = 0.0072 and 3.8% versus 2%, P = 0.0039, for multiple taxa and a single organism, respectively), results that were attributed to differences in sample collection, handling and/or transport.
After excluding microorganisms reported as contaminants, 697 (14.4%) of 4,828 samples were positive for detection of a pathogen (Table 1 and Supplementary Dataset 1). The mean annual positivity rate was 16.0% ± 4.8% standard deviation and ranged from 11.4% to 27%. Notably, the positivity rate was 27% in 2016, the year during which nearly all patients had been enrolled in the prospective Precision Diagnosis of Acute Infectious Diseases (PDAID) study6. Of note, all PDAID participants met inclusion criteria of (i) hospitalization with an acute presentation and objective evidence of meningitis, encephalitis and/or myelitis within 2 weeks of CSF sampling and (ii) lack of a diagnosis at time of enrollment. The positivity rate in UCSF samples (16.2%) was higher than in non-UCSF samples (13.9%) (P = 0.0547). This difference can be explained in part by the higher rate of subthreshold results (2.8% versus 1.8%, P = 0.0289) in UCSF patients who were reported as positives, defined as detection of reads to presumptive pathogens at levels below pre-established thresholds14. For UCSF patients, the laboratory director was able to review the patient electronic medical records, hold discussions with the clinical teams caring for the patient and examine results of surveys taken at the time mNGS testing was ordered to determine if a subthreshold result was consistent with clinical findings, thus reporting it as a positive result. Pathogens detected at subthreshold levels included Coccidioides sp. in 15 (93.4%) of 16 samples, Mycobacterium tuberculosis in 12 (92.3%) of 13 samples, Balamuthia mandrillaris in 2 (66%) of 3 samples, Histoplasma capsulatum in 2 (50%) of 4 samples, West Nile virus in 8 (28.6%) of 28 samples and Powassan virus in 3 (21.4%) of 14 samples (Supplementary Dataset 1). Most subthreshold detections by mNGS testing were able to be confirmed by orthogonal testing from another method, such as serology or PCR.
Among 697 mNGS-positive samples, 797 organisms were identified. DNA viruses were most frequently detected (n = 363, 45.5%), followed by RNA viruses (n = 211, 26.4%), bacteria (n = 132, 16.6%), fungi (n = 68, 8.5%) and parasites (n = 23, 2.9%) (Fig. 2a). The assay identified 86 nonfastidious bacterial pathogens representing 35 unique species and corresponding to bacteria that traditional culture methods can readily detect (Fig. 2b and Supplementary Table 1). The assay also detected bacterial CNS pathogens representing 24 unique species that are difficult and/or slow to grow in culture, including Mycobacterium tuberculosis (n = 13), Nocardia farcinica (n = 3), Borrelia burgdorferi (n = 2), Leptospira borgpetersenii (n = 1), Borrelia miyamotoi (n = 1) and Tropheryma whipplei (n = 1). The most common RNA viruses detected were human immunodeficiency virus (HIV) (n = 92), arthropod-borne viruses, also referred to as arboviruses (n = 57), and enteroviruses (n = 16) (Fig. 2c). Uncommon arboviruses were detected, including St. Louis encephalitis virus15, La Crosse virus, Cache Valley virus and Potosi virus, a bunyavirus not previously described in human infections and originally identified by screening of mosquito pools16. All 16 enterovirus-positive samples were typeable based on sequence recovered from the VP1 gene, and typing revealed a diversity of genotypes, including D68 and A71 associated with cases of meningoencephalitis and/or acute flaccid myelitis17,18,19. Fungal pathogens detected by mNGS testing consisted of Coccidioides sp., including Coccidioides immitis (n = 14) and Coccidioides posadasii (n = 2), Cryptococcus sp., including Cryptococcus neoformans (n = 12) and Cryptococcus gattii (n = 1), Histoplasma capsulatum (n = 4) and Fusarium sp. (n = 3). Interestingly, the Cryptococcus gattii case was negative by both CSF and serum cryptococcal antigen testing, which has previously resulted in delayed diagnosis and treatment for patients infected by this pathogen20. The assay was also able to detect parasitic infections from Toxoplasma gondii (n = 10), Balamuthia mandrillaris (n = 3), Angiostrongylus cantonensis (n = 2) and Naegleria fowleri (n = 1).

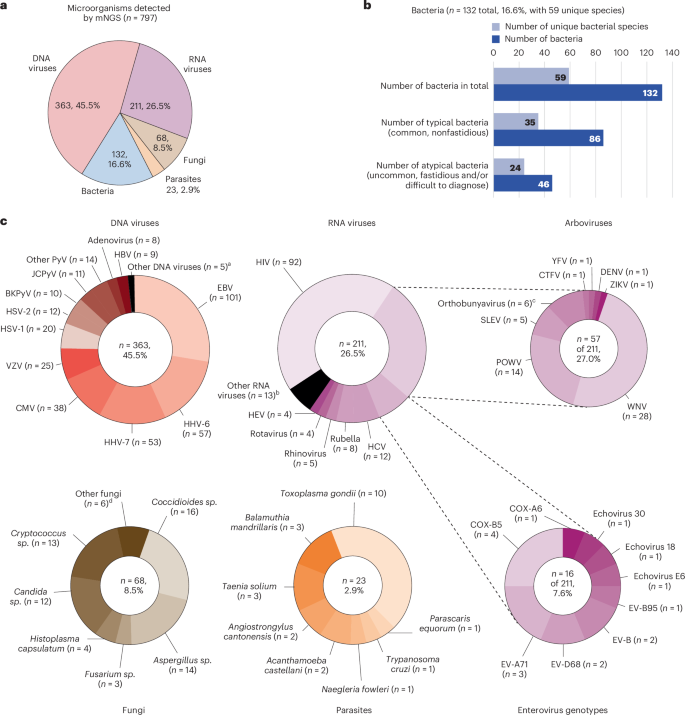
a, Number and types of organisms detected by mNGS testing. b, Detected bacterial species (total and unique), including those that are typical (nonfastidious) and atypical (uncommon, fastidious and/or difficult to diagnose). c, Detected DNA viruses, RNA viruses (including arboviruses and enteroviruses), fungi and parasites. aOther DNA viruses detected included human parvovirus 4 (n = 1), human parvovirus B19 (n = 4) and human herpesvirus 8 (n = 1). bOther RNA viruses detected included lymphocytic choriomeningitis virus (n = 3), astrovirus (n = 2), calicivirus (n = 2), coronavirus 229E (n = 2), SARS-CoV-2 (n = 1), human T cell lymphotropic virus (n = 1), human parechovirus (n = 1) and measles virus (n = 1). cOrthobunyaviruses detected included Cache Valley virus (n = 3), Jamestown Canyon virus (n = −1), La Crosse virus (n = 1) and Potosi virus (n = 1). Potosi virus is a novel species in this genus, not reported before as causing disease in humans16. dOther fungi detected included Alternaria sp. (n = 2), Mucorales sp. (n = 2), Epicoccum sp. (n = 1) and Sporothrix schenkii (n = 1). BKPyV, BK polyomavirus or human polyomavirus 1; CMV, cytomegalovirus; COX, coxsackievirus; CTFV, Colorado tick fever virus; DENV, dengue virus; EBV, Epstein-Barr virus; EV, enterovirus; HBV, hepatitis B virus; HCV, hepatitis C virus; HEV, hepatitis E virus; HHV-6, human herpesvirus 6; HHV-7, human herpesvirus 7; HSV, herpes simplex virus; HIV, human immunodeficiency virus; HTLV-2, human T cell lymphotropic virus 2; JCPyV, JC polyomavirus or human polyomavirus 2; NAAT, nucleic acid amplification testing; POWV, Powassan virus; SLEV, St. Louis encephalitis virus; VZV, varicella-zoster virus; WNV, West Nile virus; YFV, yellow fever virus; ZIKV, Zika virus.
Source data
UCSF patient cohort
Results from mNGS testing of 1,164 samples performed from June 2016 to June 2023 for 1,053 UCSF patients were analyzed and retrospective chart review was performed. Among the 1,053 UCSF patients, 579 were male (55.0%), 160 (15.2%) were children, 893 (84.8%) were adults and 377 (35.8%) were immunocompromised. Each sample represented a single hospitalization or outpatient clinic visit and was thus designated as a separate case, as some patients had multiple samples tested by mNGS. Among the 1,164 cases analyzed by mNGS testing, 1,021 (87.7%) were hospitalized with a median length of stay of 12 days (interquartile range (IQR) 5 − 25 days), 450 (38.7%) were admitted to an intensive care unit (ICU), and 119 (10.2%) died within 60 days of admission. The UCSF cohort consisted of cases of microbiologically- confirmed CNS infection (n = 209, 18%), autoimmune disease or another noninfectious condition (n = 432, 37.1%), prion disease (n = 1, 0.1%), or unknown etiology after 6 months of longitudinal follow-up (n = 522, 44.8%) (Table 2). For each case, the average number of microbiological tests performed was 20.2 in total, 6 from CSF and 14.2 from other sample types, and consisted of a mix of culture-based (n = 5.7), nucleic acid amplification (n = 5), antigen (n = 2.7), and serologic (n = 6.8) testing. Among 209 confirmed CNS infectious etiologies, seven cases were polymicrobial, with each causative organism analyzed as a distinct infection for a total of 220 CNS infections. The mNGS positivity rate was higher for immunocompromised (16.7%) than immunocompetent (7.1%) patients (P < 0.0001), and higher for meningitis (15.4%, P = 0.0466) and meningoencephalitis (17.8%, P = 0.0103) than encephalitis (9.9%) patients (Table 2).
We established a composite diagnosis for each case that incorporated all microbiological testing results and clinical adjudication performed independently by three infectious disease physicians, with discrepancies resolved by consensus (Supplementary Dataset 2). Among the 1,164 cases, 180 (15.5%) were positive for the identification of one or more microorganisms by mNGS testing (Table 2 and Methods). Out of the 180 positive cases, 227 organisms were detected, of which 3 had been reported as contaminants but were reclassified as clinically meaningful detections after adjudication (Supplementary Tables 2 and 3). Among the 227 detected organisms, 135 were adjudicated as true positive, 4 as false positive, 85 as incidental detections, such as detection of human immunodeficiency virus 1 (HIV-1) in an infected patient, and 3 as detections of unclear importance for which causality could not be determined (Fig. 3 and Supplementary Table 5). 35 (15.4%) of 227 detected organisms were subthreshold detections, of which 32 (91%) were true positive infections, and the remaining 3 (8.6%) incidental or of unclear importance.

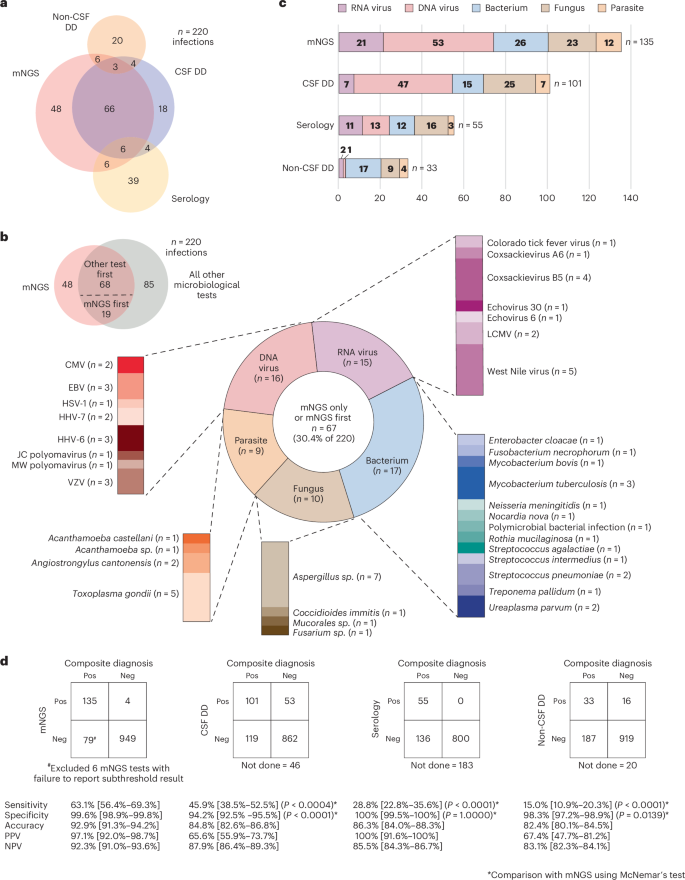
a, The proportional Venn diagram displays the overlap among four modalities (mNGS, CSF direct detection, non-CSF direct detection and serologic testing) in diagnosis of CNS infections. b, Pathogens detected by mNGS testing only (n = 48) or mNGS testing first (n = 19). Among the 19 pathogens that were detected by mNGS testing first, 11 pathogens were detected by another microbiologic test run in parallel, whereas 8 were detected by another test, but only for orthogonal confirmation of the initial mNGS positive result. c, Number and types of pathogens detected by each of the 4 diagnostic modalities. d, 2 × 2 contingency tables showing the comparative performance of mNGS testing compared to other diagnostic modalities. The P value is based on comparison between mNGS and a conventional testing modality using the two-sided McNemar’s test. CMV, cytomegalovirus; EBV, Epstein-Barr virus; HHV-6, human herpesvirus 6; HHV-7, human herpesvirus 7; LCMV, lymphocytic choriomeningitis virus; Neg, negative; NPV, negative predictive value; Pos, positive; PPV, positive predective value; VZV, varicella-zoster virus.
Source data
A proportional Venn diagram revealed that among the 135 true positive infections diagnosed by mNGS testing, 48 were made only by this modality, comprising 21.8% of all 220 infectious diagnoses in the UCSF cohort (Fig. 3a,b). An additional 19 infectious diagnoses were made first by mNGS testing, of which 8 were subsequently confirmed by orthogonal testing. mNGS testing was the most sensitive modality for detection of all pathogen types except fungi, which were identified more often by other CSF direct detection (CSF-DD) methods (Fig. 3c). Among 10 fungal infections missed by mNGS testing, including 7 cases of Cryptococcus neoformans and 3 of Coccidioides sp., 7 were identified by an antigen testing, 2 by culture, and 1 by both antigen testing and culture. Overall, mNGS testing exhibited a sensitivity of 63.1%, specificity of 99.6%, accuracy of 92.9%, positive predictive value of 97.1% and negative predictive value of 92.3% for diagnosis of CNS infections (Fig. 3d). The sensitivity or diagnostic yield of mNGS testing (63.1%) was higher than that for all other modalities, including CSF-DD testing (45.9%, P < 0.0004), non-CSF direct detection testing (15.0%, P < 0.0001), and indirect serologic testing from serum, plasma, or CSF (28.8%, P < 0.0001) (Fig. 3d). When considering only cases diagnosed by CSF-DD testing, the sensitivity of mNGS testing increased to 86% (Supplementary Dataset 2). Sensitivity of mNGS testing was 72.1% for encephalitis, 62.7% for meningitis, 59.4% for meningoencephalitis, 33.3% for myelitis and 62.1% for other syndrome (P = 0.5519) (Supplementary Dataset 2).
Turnaround times for the 135 positive mNGS tests from sample collection to result were compared (Supplementary Table 6). The median turnaround time was 9 days (IQR 7–11 days), which was longer than other diagnostic modalities, including CSF-DD testing (4 days (IQR 1–8 days), P < 0.0001), non-CSF direct detection testing (6 days (IQR 5–12 days), P = 0.0427), and serology (6 days (IQR 3–7.5 days), P < 0.0001). Of note, mNGS was generally ordered later than conventional tests, as the laboratory turnaround time was only 3.6 days (Table 1). Thus, we also evaluated the positivity rate based on the time from sample collection to start of processing (Supplementary Table 7). Among all 1,164 mNGS tests, 37.3% were early (<3 days from CSF collection to the start of sample processing), 47.7% were second-line (3–7 days), and 15% were late (>7 days). The positivity rate for mNGS testing was higher for early (12.4%, P = 0.0809) and second-line (10.8%, P = 0.1564) than for late (7%) testing, although these differences were not statistically significant.
We analyzed discrepant results between mNGS testing and other CSF-DD methods. mNGS testing identified 60 infections that were not detected by CSF-DD methods (Supplementary Table 8). Of the 60 mNGS+/CSF−DD− infections, 19 (31.7%) pathogens were not detected by CSF-DD methods because the diagnosis had not been considered by the treating clinicians a priori despite the availability of targeted testing, 11 (18.3%) because a test to detect the pathogen was not readily available (for example, detection of lymphocytic choriomeningitis virus (LCMV) and Angiostrongylus cantonensis), and 30 (50%) because conventional testing results were false negative, including 12 (20%) cases of culture-negative mycobacterial or fungal infection and 9 (15%) culture-negative cases attributed to effective antimicrobial treatment prior to CSF collection. Conversely, CSF-DD methods were able to detect 26 infections missed by mNGS testing (Supplementary Table 9). Of the 26 mNGS−/CSF DD+ infections, 10 (38.5%) were associated with high host background and hence reduced assay sensitivity14,21, 4 (15.4%) were in patients with fungal infections who had received prior treatment, 7 (29.2%) were low-titer samples, and 4 (15.4%) were samples with positive subthreshold mNGS test results that had not been reported (Fig. 4a). No explanation for discrepant results was found in 1 (3.8%) mNGS false-negative infection. Notably, all 4 patients with fungal infections missed by mNGS had remained antigen positive for Cryptococcus sp. or Coccidioides sp. despite a median 12 days of antifungal treatment. Persistence of cryptococcal antigen in CSF weeks to months after effective antifungal therapy has been previously reported22.

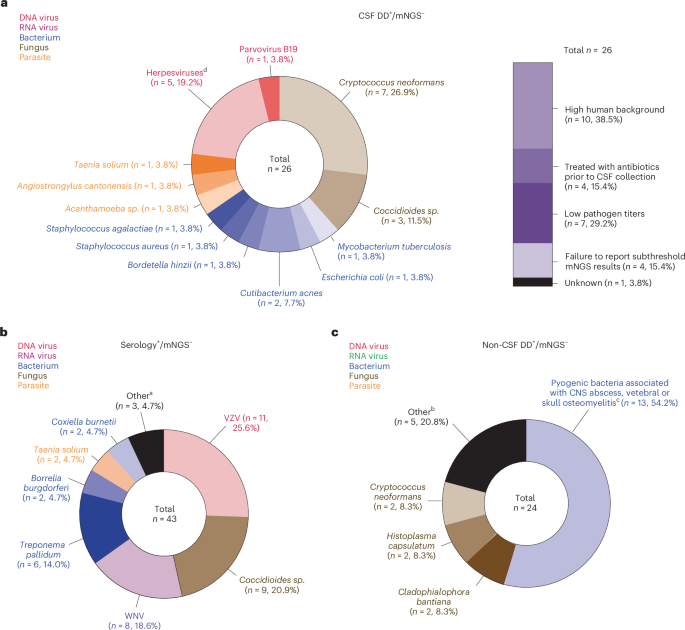
a, 26 samples were positive by direct detection CSF testing and negative by mNGS testing. Of these false-negative results, 10 (38.5%) were attributed to high DNA host background, a known limitation of mNGS approaches, and 4 (15.4%) to persistent antigen positivity from fungal infection after onset of treatment. b, 43 samples were positive by serology and negative by mNGS testing. Most of these false-negative results can be explained by the presumed absence of nucleic acid in the samples at the time of CSF collection, a known limitation of direct detection methods. c, 24 samples were positive by non-CSF direct detection testing and negative by mNGS testing. In these cases, the causative pathogen is presumed absent in CSF and only detectable from infected tissue or abscesses. aHSV-1, HSV-2, CMV, EBV and VZV. bListeria monocytogenes, Sporothrix shenckii., and EBV. cRhizopus sp., Candida albicans, Balamuthia mandrillaris, enterovirus and VZV. dMycobacterium chelonae, Pseudomonas aeruginosa, Staphylococcus aureus (n = 3), Enterococcus faecalis, Citrobacteri koseri, Streptococcus mitis, Cutibacterium acnes, Aggregatibacter sp., Bacillus cereus, Parvimonas micra and Streptococcus intermedius. CMV, cytomegalovirus; CSF DD, CSF direct detection testing; EBV, Epstein-Barr virus; HSV, herpes simplex virus; non-CSF DD, direct detection testing of samples other than CSF; VZV, varicella-zoster virus; WNV, West Nile virus.
Source data
False-negative mNGS cases with positive CSF or blood serology occurred for 43 infections (Fig. 4b), including varicella-zoster virus (n = 11, 25.6%), Coccidioides sp. (n = 9, 20.9%), and West Nile virus (n = 8, 18.6%). These false-negative results can be explained by absence of nucleic acid in CSF at time of collection, a known limitation for all direct detection methods, including mNGS. False-negative mNGS cases with positive non-CSF direct detection testing occurred for 24 infections (Fig. 4c). Many infections were caused by pyogenic bacteria associated with CNS abscesses or skull/vertebral osteomyelitis (n = 13, 54.2%), for which the pathogen was only detectable from infected brain tissue or abscess fluid.
link